MICRESS® Applications
Grain growth and recrystallization
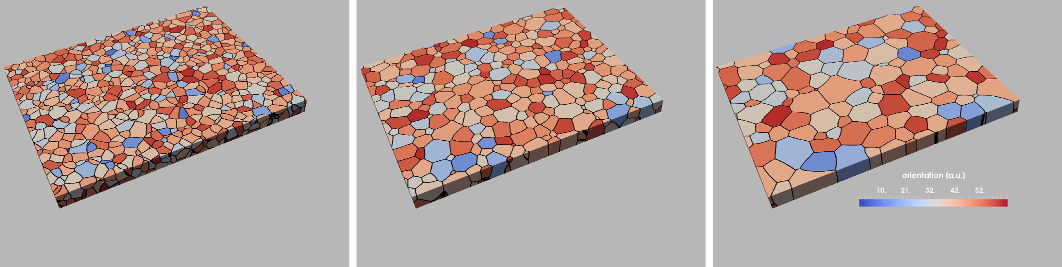
Fig.1: Grain coarsening in a "thick film", for an animation of 2D grain growth in HD resolution click here.
Grain growth, i. e. coarsening of a grain structure driven by the local curvature of grain boundaries is a fundamental microstructure transformation when materials are subjected to elevated temperatures. Governing material properties for coarsening are grain boundary energies and their mobility. These are dependent on interactions between the grain boundary and solutal atoms as well as precipitates, the mechanisms of solute drag and particle pinning respectively. For both mechanisms, specific models are implemented within MICRESS®.
Different possibilities for the definition of the initial grain structure are offered: explicit positioning of individual grains, weighted Voronoi-constructions or even importation of microstructures from experimental data in ascii or vtk file formats. The grain structure can be evaluated and characterised in many different ways. Fig.2 shows the simplest evaluation, the average grain size derived from the number of grains as a function of time comparing different grain boundary models.
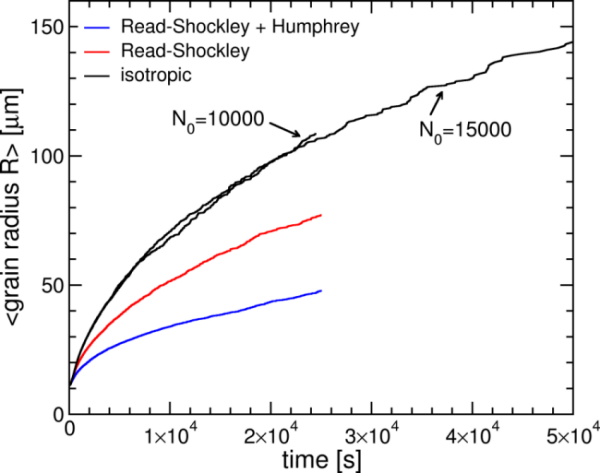
Fig.2: Average grain size as a function of time (2D simulations) for three different grain boundary models: “isotropic” (constant energy and mobility), Read-Shockley (low angle grain boundary energy model) and Read-Shockley together with a LAGB mobility model according to Humphreys.
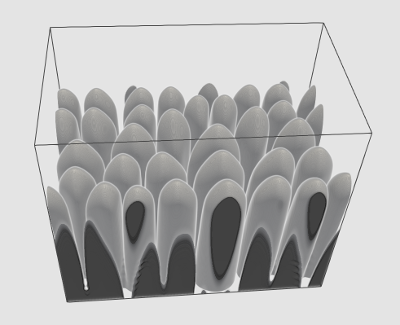
3D phase-field simulations of graphite growth in ductile cast iron
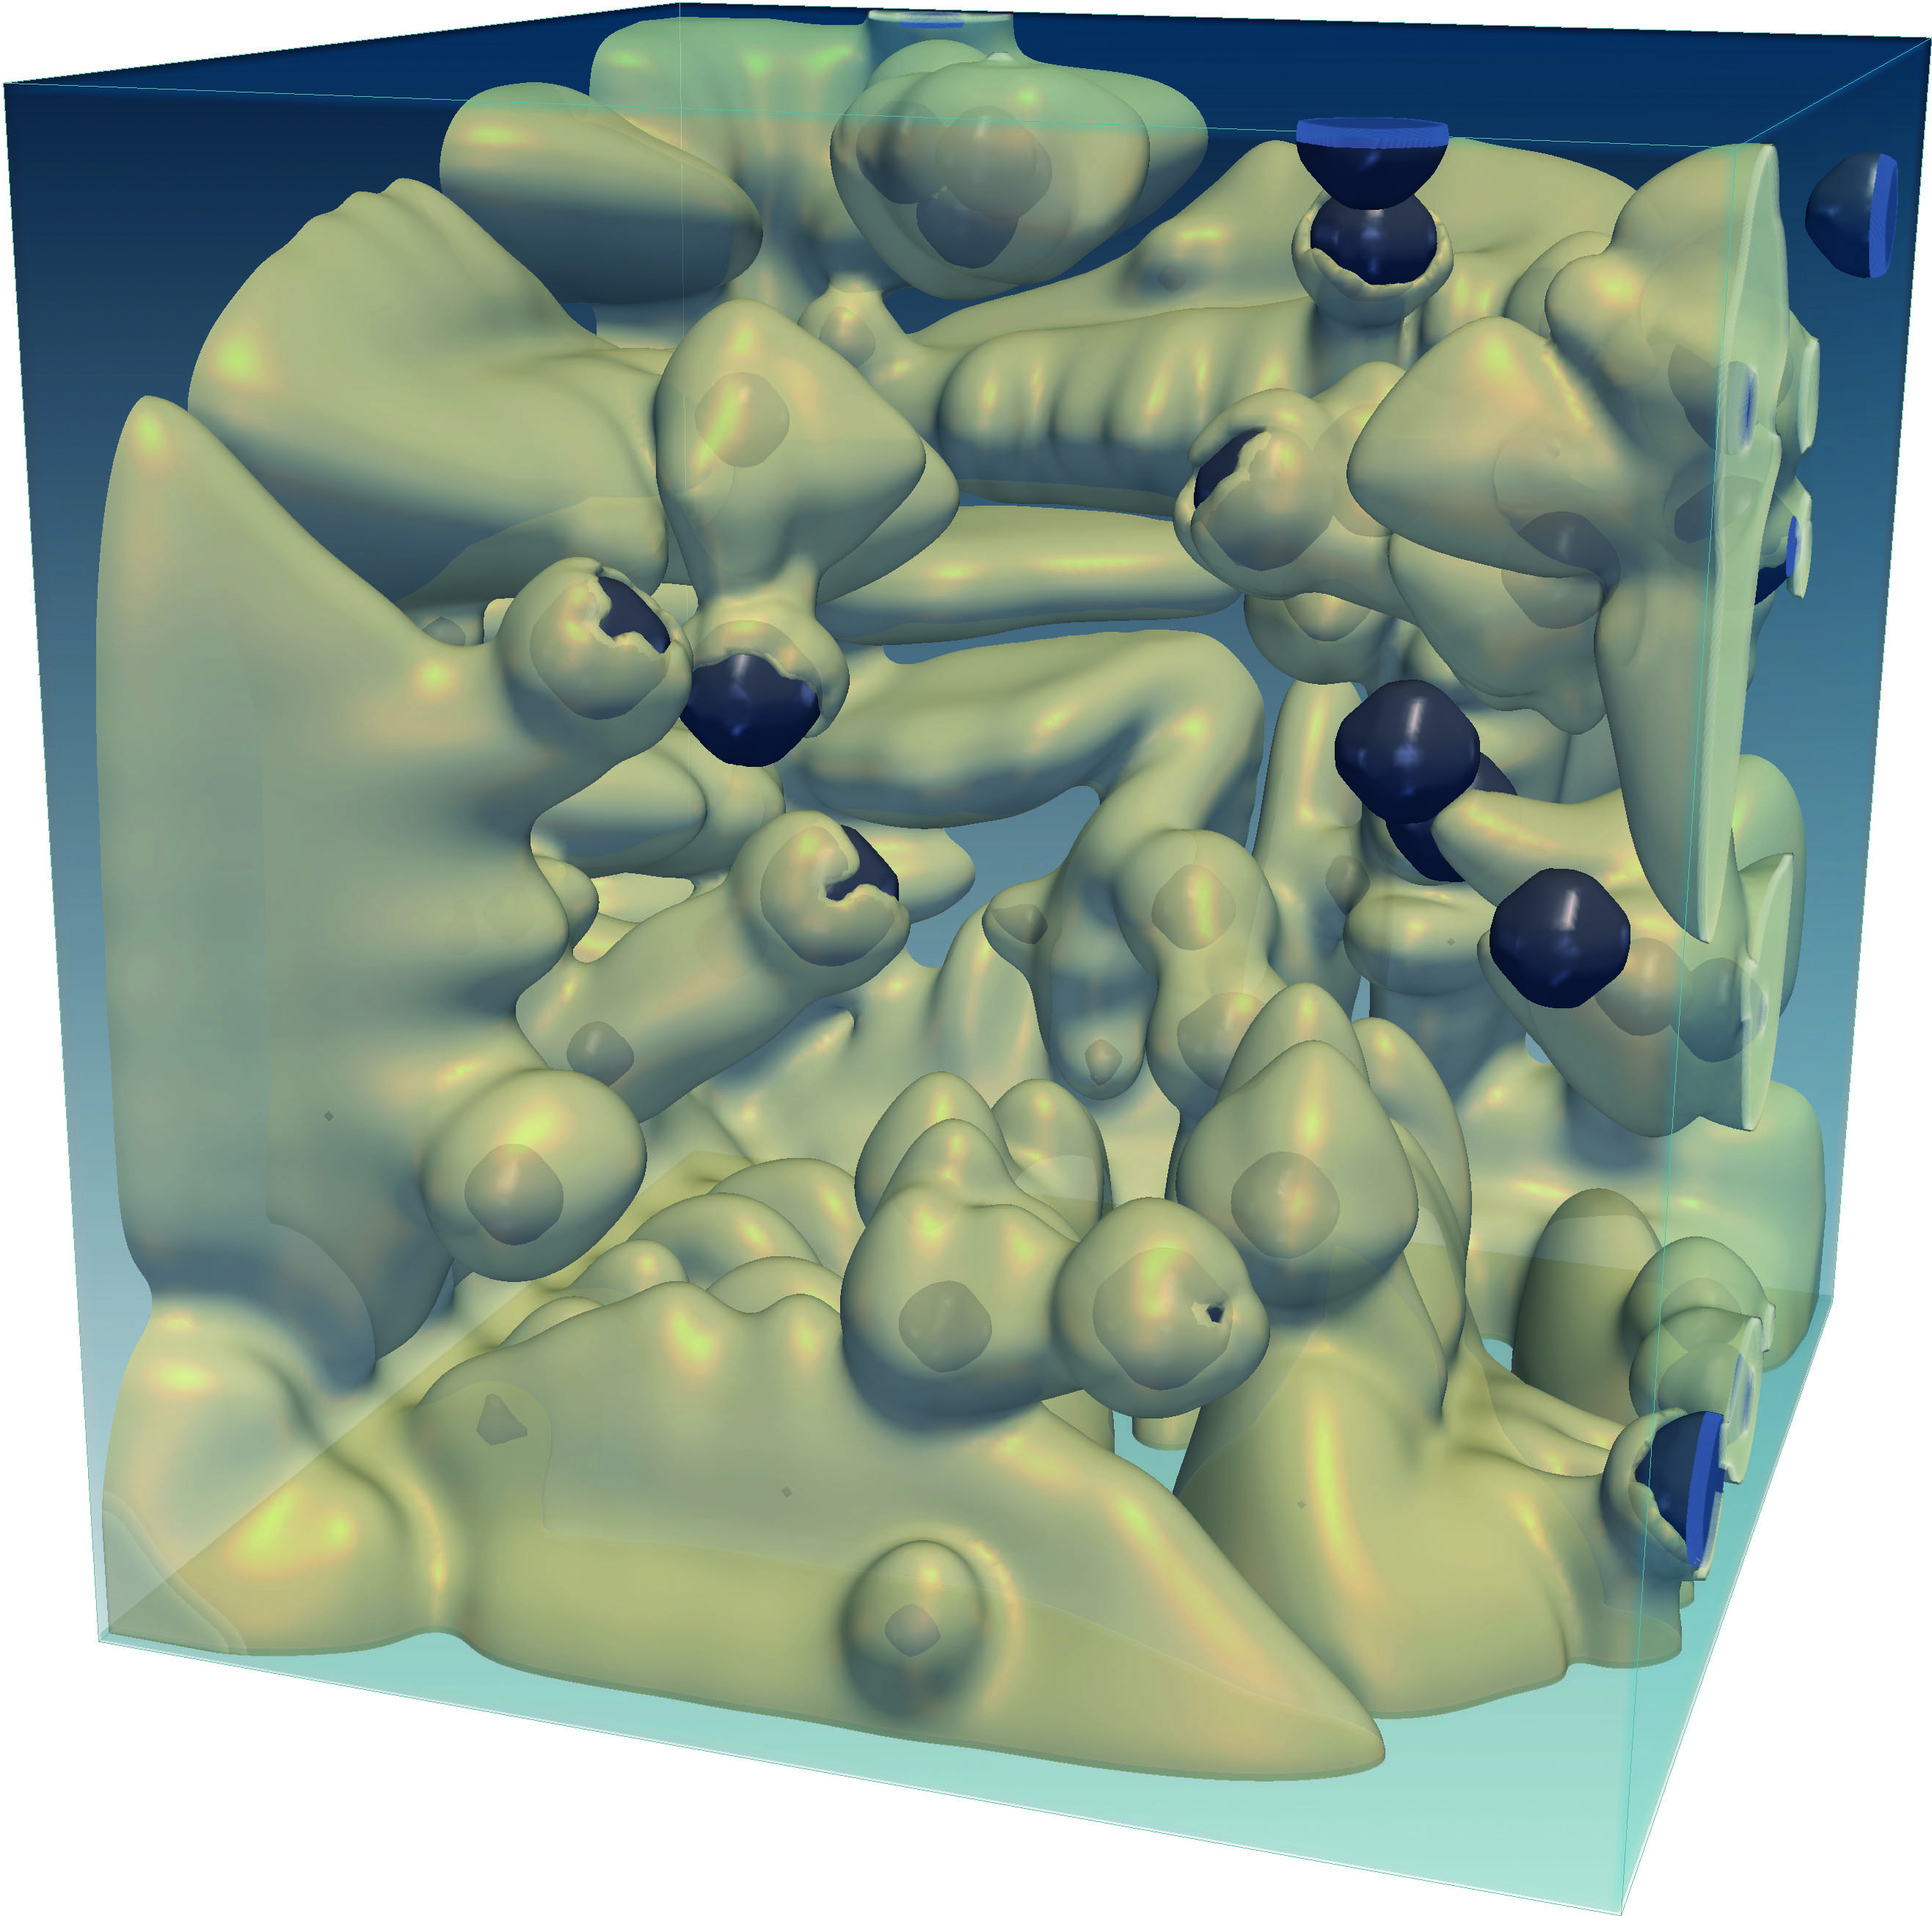
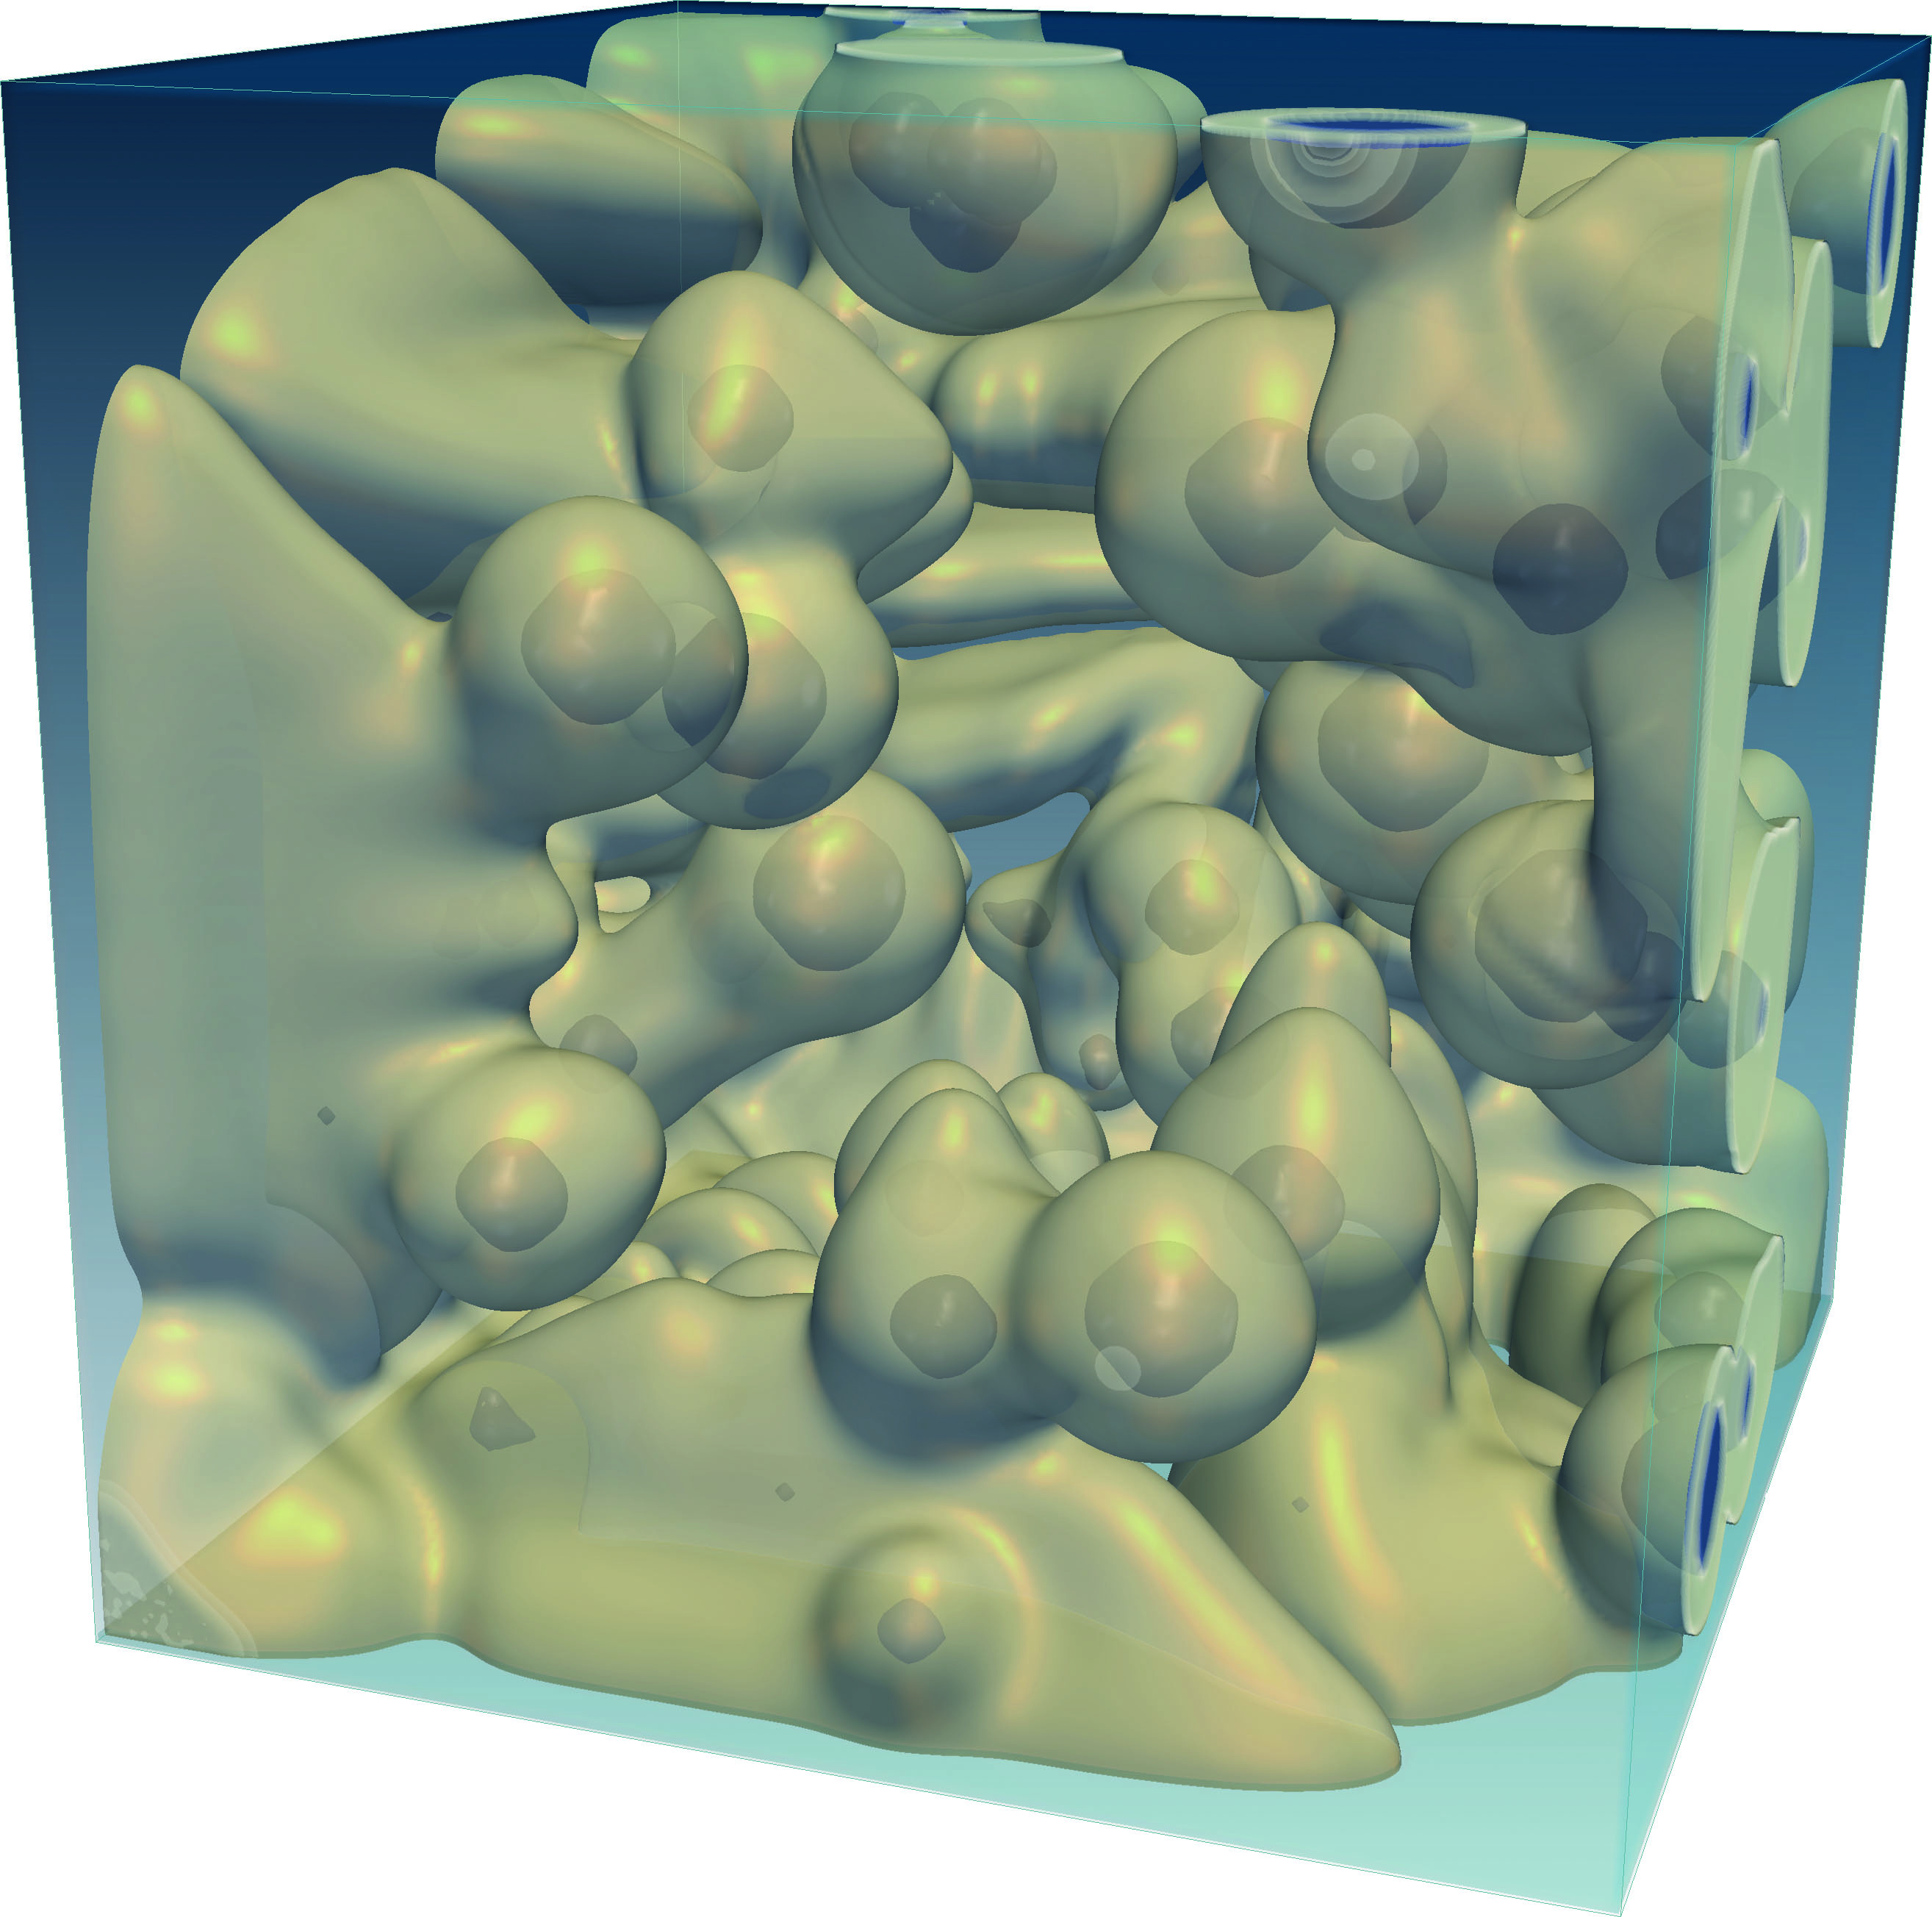
The MICRESS® software was applied to simulate the microstructure evolution of multicomponent ductile cast iron (Fe-C-Si-Mn-Mg). During initial solidification, dendritic austenite and graphite nodules grow as a divorced eutectic. Whenever a graphite nodule gets into direct contact with the austenite, it becomes rapidly encapsulated and isolated from the melt. The subsequent growth of this nodule is then controlled by interstitial diffusion of carbon through the austenitic shell. During this indirect eutectic transition, the volumetric expansion of the graphite causes a pushing of the enveloping austenitic shell, i.e. a local transport of Fe as well as solute atoms. Molar volumes as well as all other thermodynamic data were evaluated by online coupling to the Calphad database TCFE8, and the diffusion data was derived from the mobility database mobFe3.
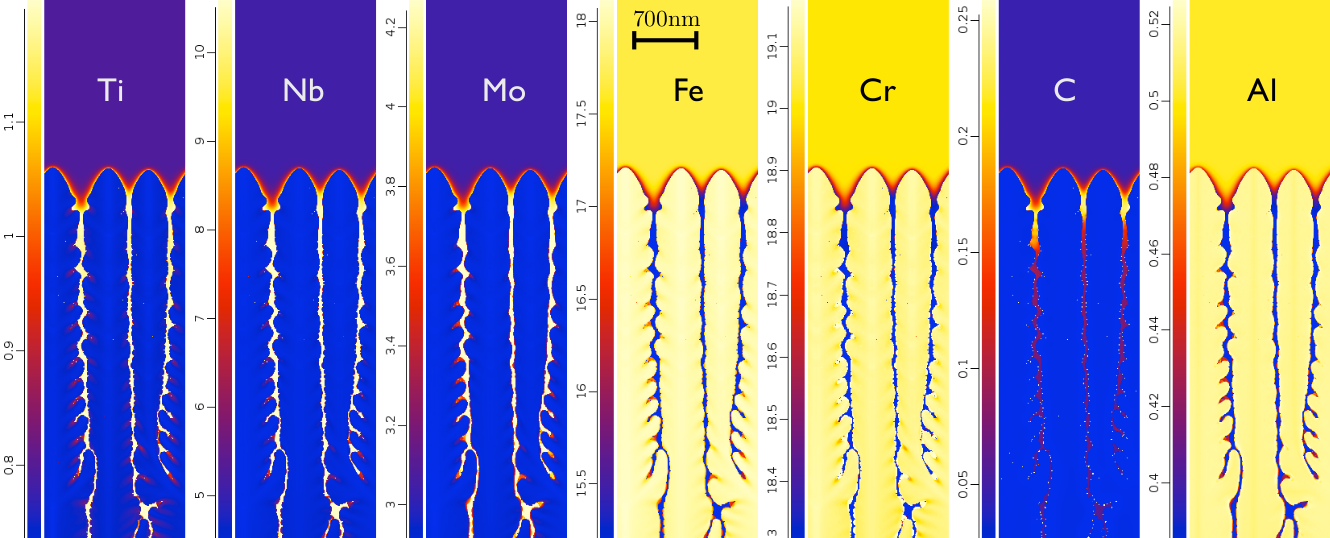
Additive manufacturing
Multi-phase and multi-component simulation of solidification in IN718 (nickel-based superalloy) under Selective Laser Melting (SLM) conditions for Additive Manufacturing applications has been modelled. The dendrite spacing exhibits a good qualitative agreement with experiments in spite of the strongly out-of-equilibrium conditions that characterize the SLM process (cooling rates of the order of millions of Kelvin per second and thermal gradients of the order of tenths of millions of Kelvin per meter). Among other effects, the nucleation and growth of Nb3C carbides (hardly visible at this scale) consumes C in the liquid channels yielding a maximum for the C-concentration immediately behind the dendrite tips.
Diffusion Brazing of Alloy 247
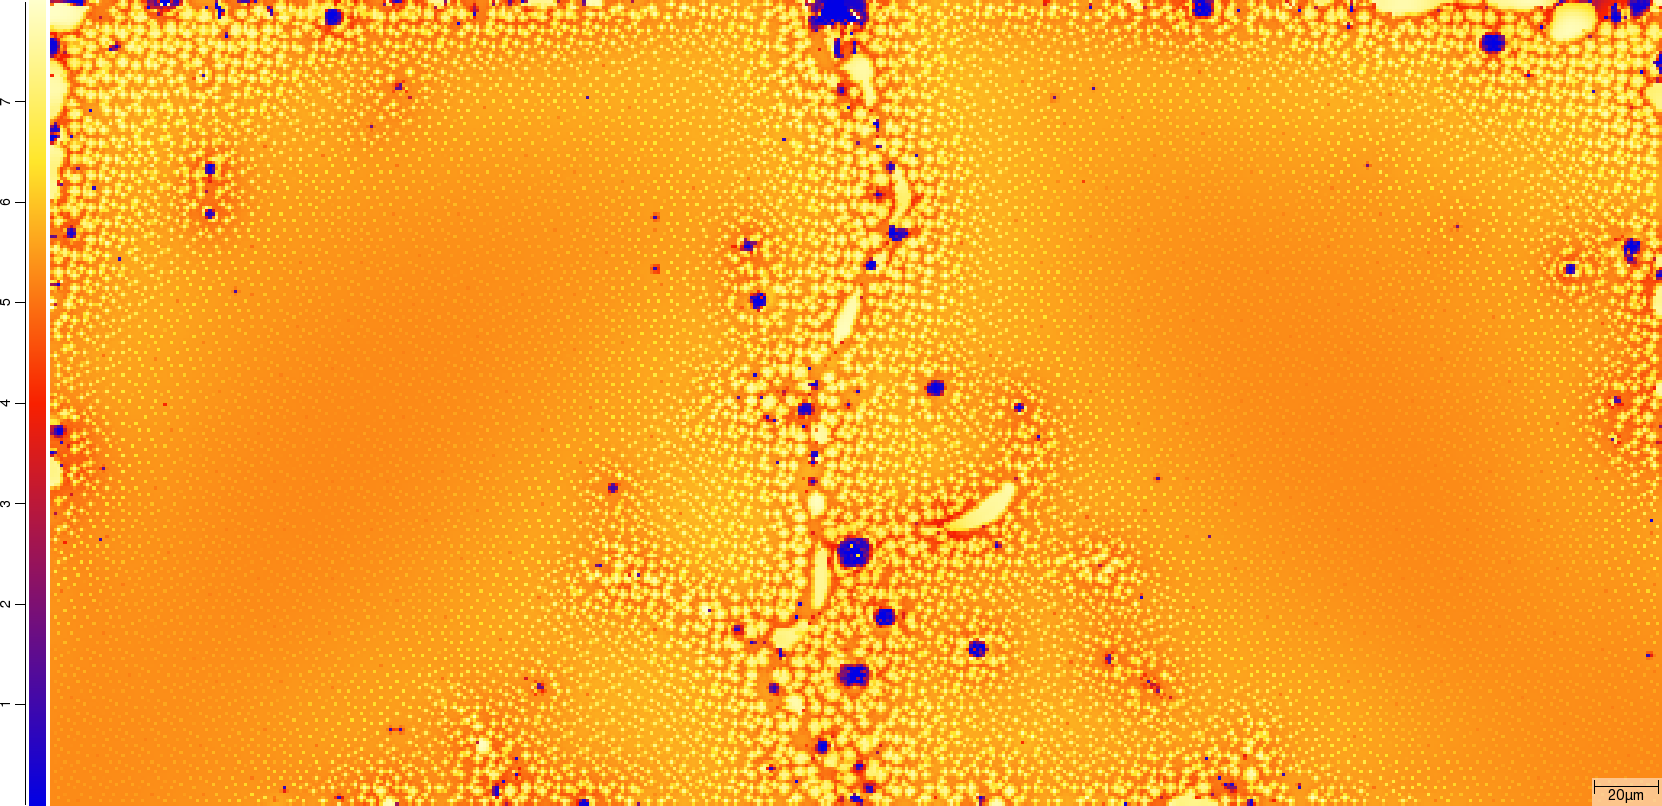
Fig.1: Aluminium distribution after solidification
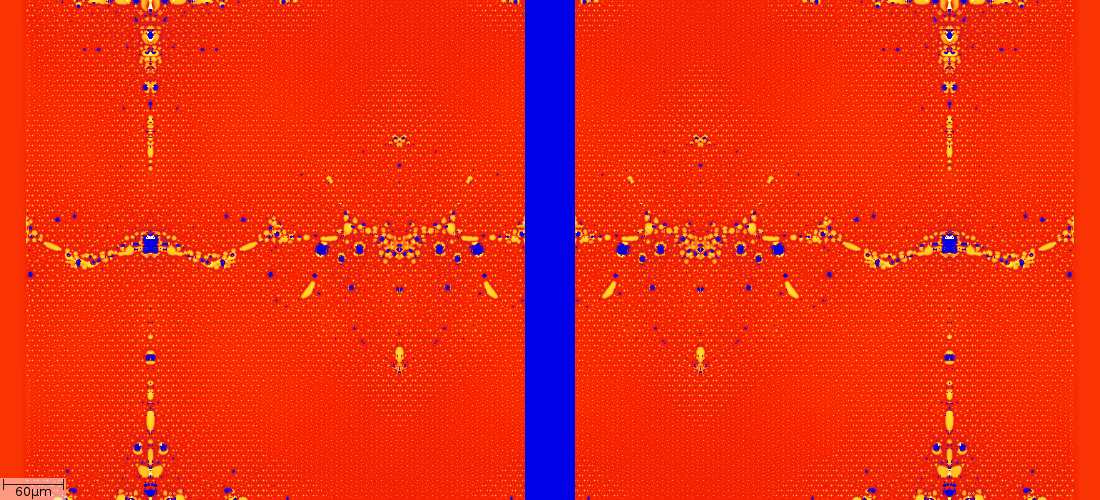
Fig.2: Setup of the simulation domain
Repair brazing using an amorphous Ni-Cr-B filler has been simulated in a joint project with Siemens Power and Gas Division, Berlin, using the MICRESS® software and the databases TTNI7 and MOBNI1. The initial microstructure was created by simulating solidification and solution heat treatment taking into account the elements Ni, C, Cr, Co, Mo, W, Ti, Al, B, Ta and Hf (Fig. 1 shows the Al distribution after solidification). Then, the RVE of the brazing simulation was combined with the brazing foil using the restart functionality of MICRESS®.
For saving simulation time, mirror symmetry was taken into account (Fig. 2) Fig. 3 shows an intermediate stage of the brazing process, displayed is the Al distribution. Detached melting behind the solidification front leads to increased melting and nucleation of new austenite grains [1]. Finally, after complete solidification, Fig. 4 shows the (Ti,Hf)B2 borides which have formed on both sides of the braze gap (Ti distribution). In all, 7 different types of borides could be observed.
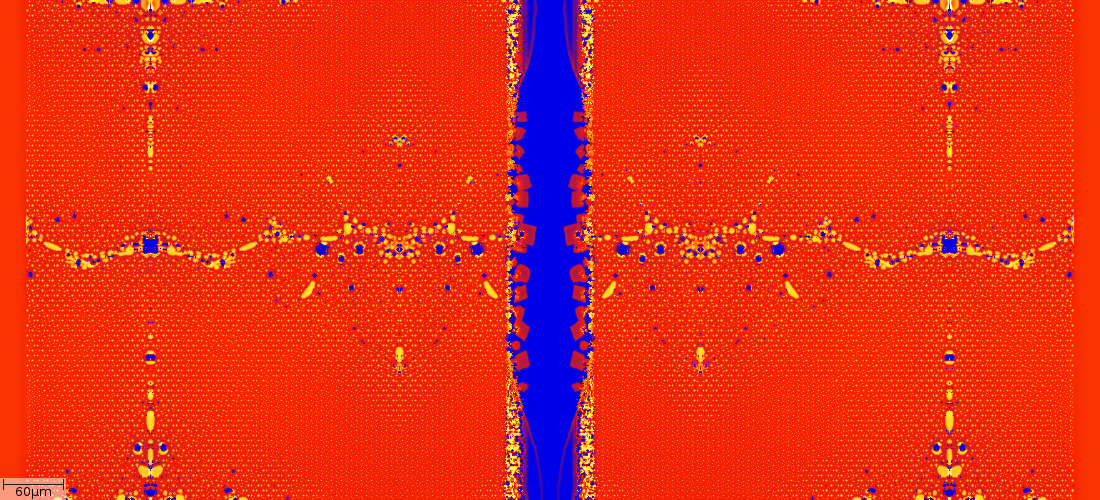
Fig.3 : Detached melting connected γ' precipitation
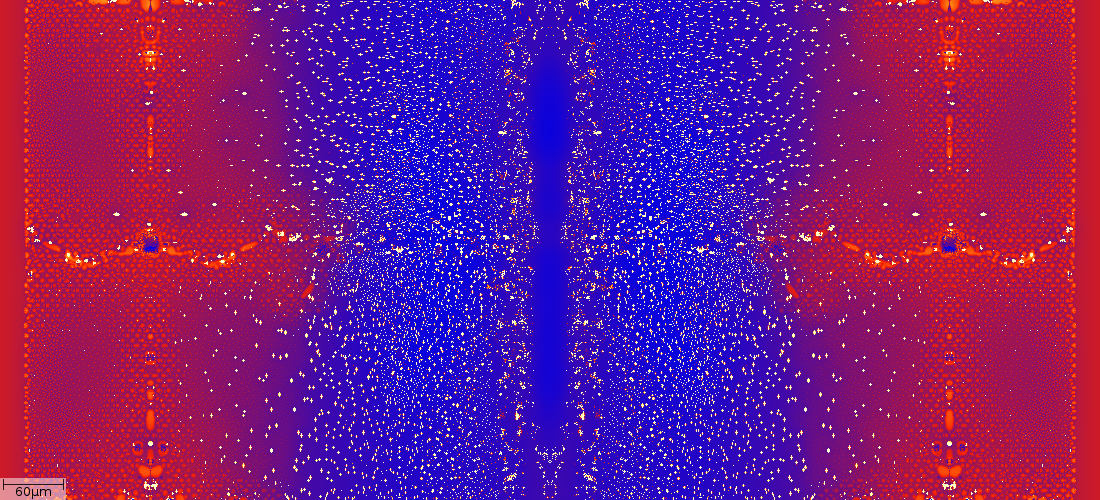
Fig.4 : Distribution of titanium borides after brazing
Austenite to Ferrite Phase Transformation of a Low Carbon Steel
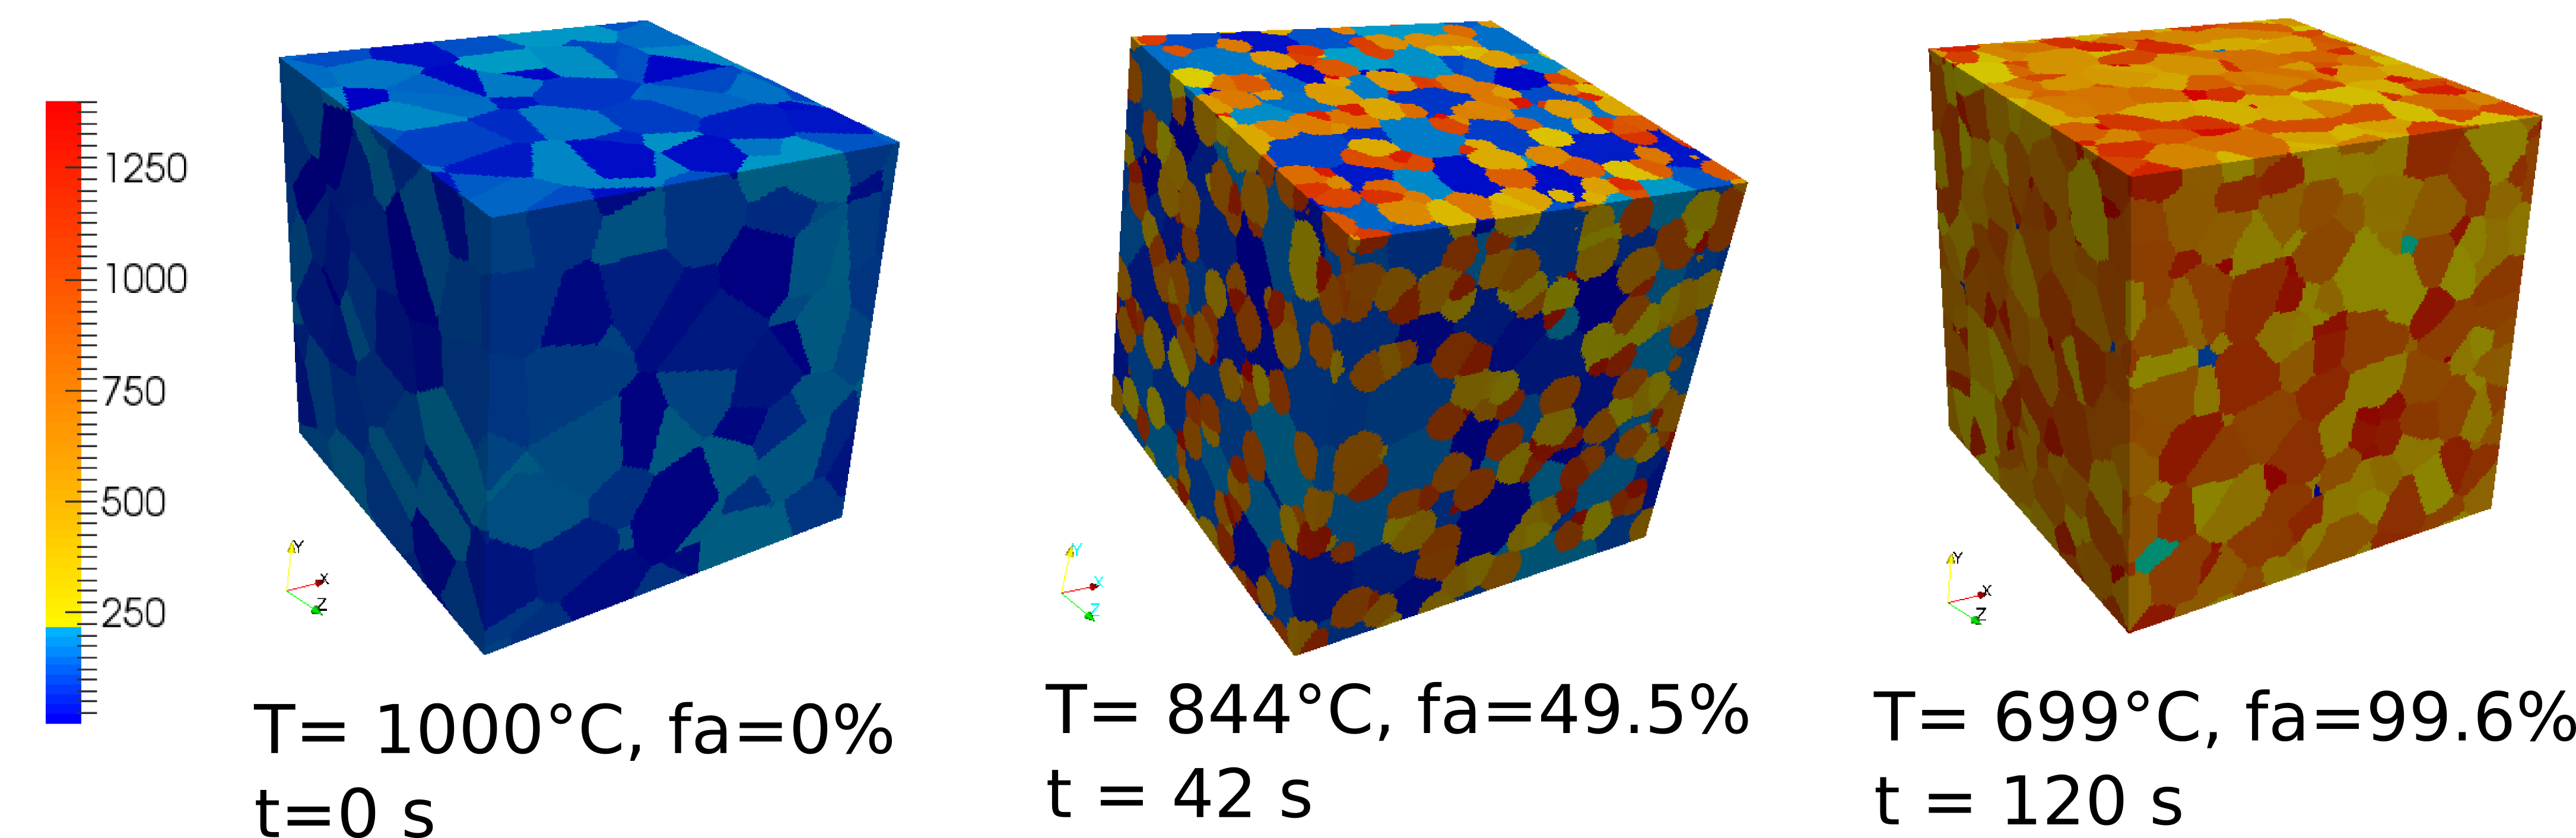
Fig.1 : Phase field simulation of the austenite to ferrite phase transformation during cooling.
A synthetic 3D RVE of the initial austenite microstructure of a Fe-0.023C-0.17Mn-0.009Si [wt %] low carbon steel is generated by Voronoi tessellation within MICRESS®. It contains 213 randomly oriented grains and is discretized by 1543 cells. During cooling, MICRESS simulates the phase transformation kinetics as a C diffusion process. The austenite phase transforms into ferrite without cementite formation but with residual austenite grains over the temperature range shown in Fig. 1.
From the MICRESS® simulation, at selected time steps, the simulated microstructure is extracted as well as the grain orientation file and transferred to HOMAT. Thermoelastic homogenization is then performed. Fig. 2 and 3 illustrate the temperature variation of the effective Young modulus and of the volumetric eigenstrain. Ehom(T) # decreases strongly during phase transformation; whereas the effective eigenstrain increases during this transformation due to larger molar volume of ferrite than austenite. Moreover, a simulated dilatometer curve is generated which can be compared to an experimental one.
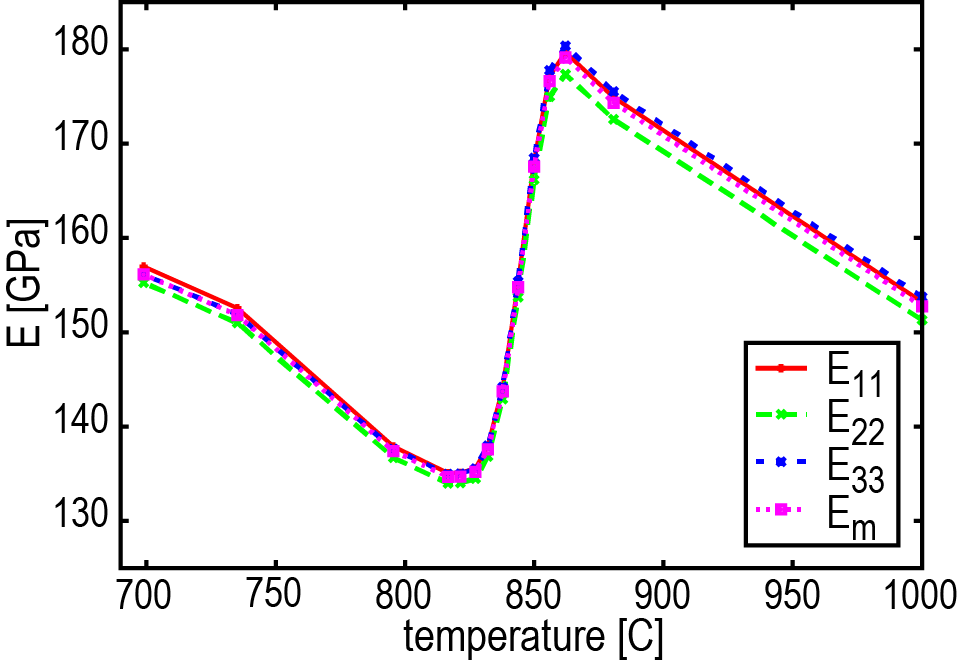
Fig.2 : Temperature variation of the effective Young modulus during the cooling process..
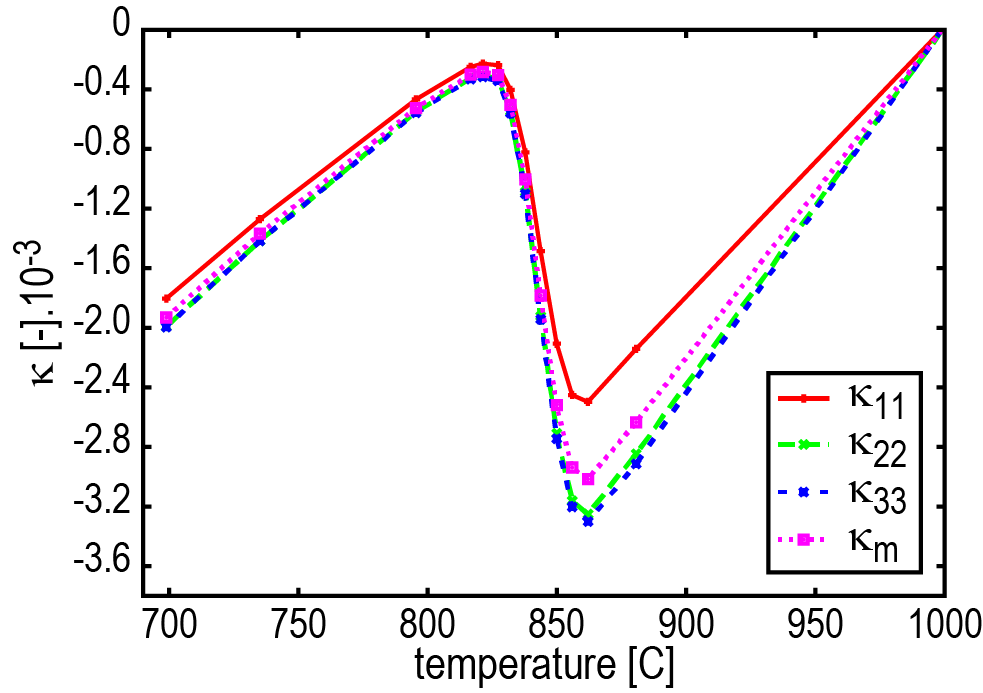
Fig.3: Temperature variation of the volumetric eigenstrain during the cooling process.
Equiaxed and Directional Solidification of a AlSi7Mg03 Alloy
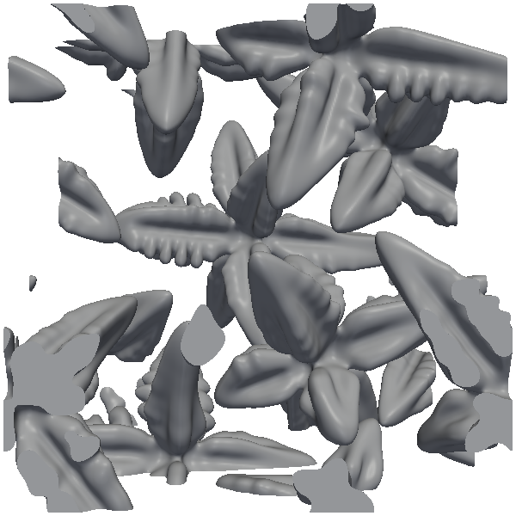
Fig.1 : Evolution of the equiaxed and directional solidified A356 microstructures: primary equiaxed dendrites grow in the bulk during isothermal solidification.
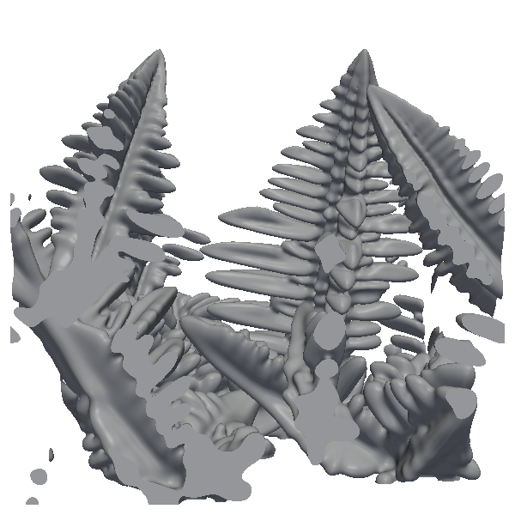
Fig.2 : Directional fcc Al dendrites nucleate at the bottom and grow in the thermal gradient direction during non-isothermal solidification.
From the thermal analysis of the solidification of an axisymmetric A356 bowl in die casting local cooling curves are derived. A volumetric heat extraction rate of -240 J/cm3 is applied on the RVE with and without a thermal gradient of 15 K/mm (from bottom to top), such that the thermal histories at macro- and microscale are consistent. The multicomponent phase field simulation with MICRESS® predicts the primary solidification of six dendritic fcc Al grains, either of equiaxed or directional morphology. Then, at fS ≈ 50% Si eutectic begins to form and at the end of solidifcation small Mg2Si particles occur (see Fig. 1 and 2).
Dendritic microstructures are extracted at selected fraction solids and transferred to HOMAT. Thermal and thermoelastic homogenization runs are performed for both dendritic morphologies. In Fig. 3 and 4 the effective thermal conductivity of the mushy zone during equiaxed and directional solidification is plotted as function of the temperature. Due to undercooling and recalescence phenomena, the relationship between thermal conductivity and temperature is non-unique in the mushy zone; whereas the λ(fS) curves are unique and more suitable for casting simulations. Moreover, the adopted multiscale approach (phase field simulation + homogenization) outperforms experimental measurements as the laser flash method is not able to distinguish the equiaxed from the directional solidification.
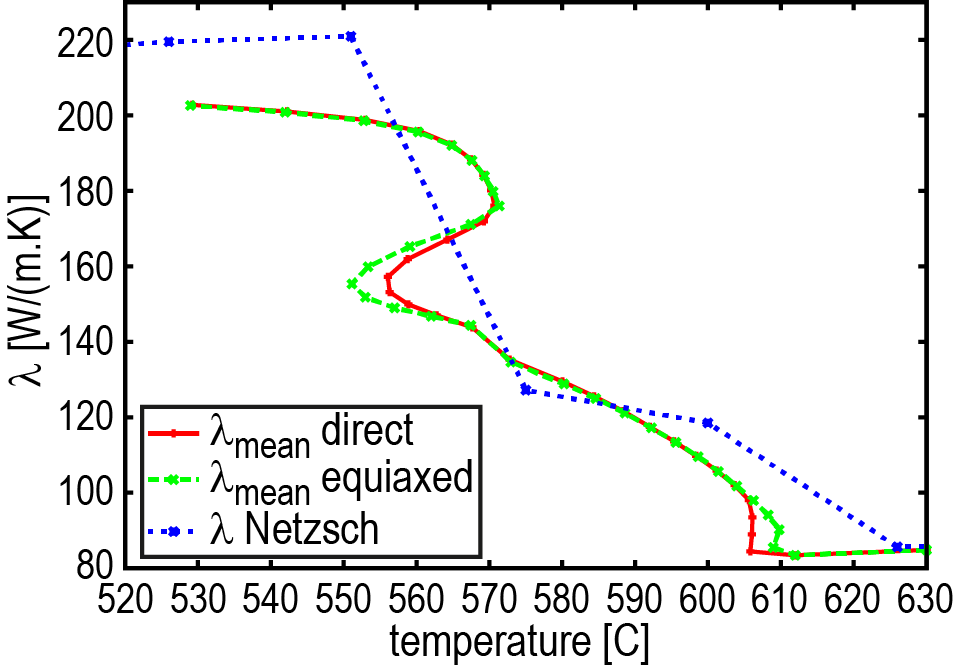
Fig.3 : Effective thermal conductivity of the mushy zone during equiaxed and directional solidification are plotted as function of the temperature (The experimental thermal conductivity measured by laser flash is added).
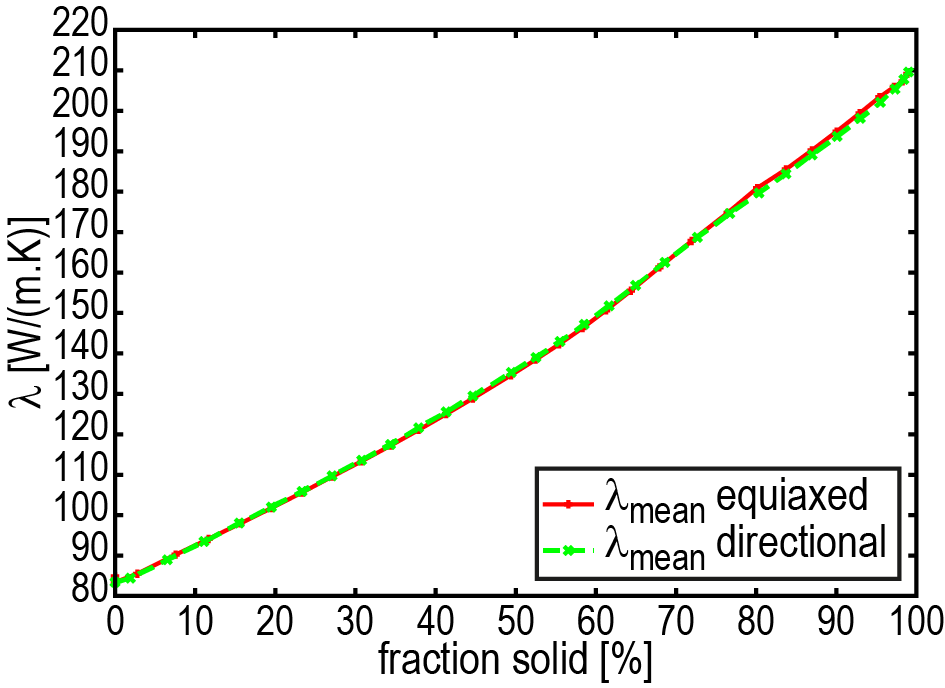
Fig.4: Conductivity as a function of fraction solid
The effective homogenized elastic modulus of the directional morphology as well as the volume averaged elastic modulus are outlined in Fig. 5 as function of fS. HOMAT performs a noticeable correction of the volume averaged value due to large implicit forces (mainly near fS = 50%) generated at the solid-liquid interfaces. In Figure 6, Ehom(T) is plotted non only for the mushy zone but for the whole cooling process as well as an experimental curve [1]. A significant difference is recorded above 300°C, due to the fact that Ehom is purely elastic and contains no viscous effect; whereas the experimental Eexp values contain always viscous effects at high temperatures.
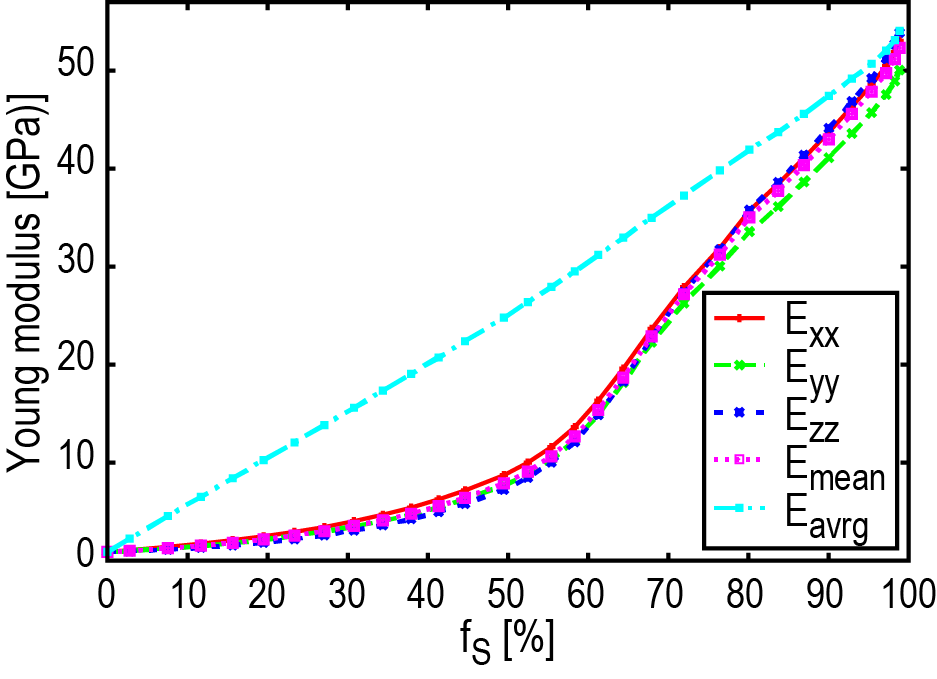
Fig.5 : Effective Young moduli per direction, the mean modulus as well as the volume averaged one of the directional solidified microstructure as function of the fraction solid in the mushy zone
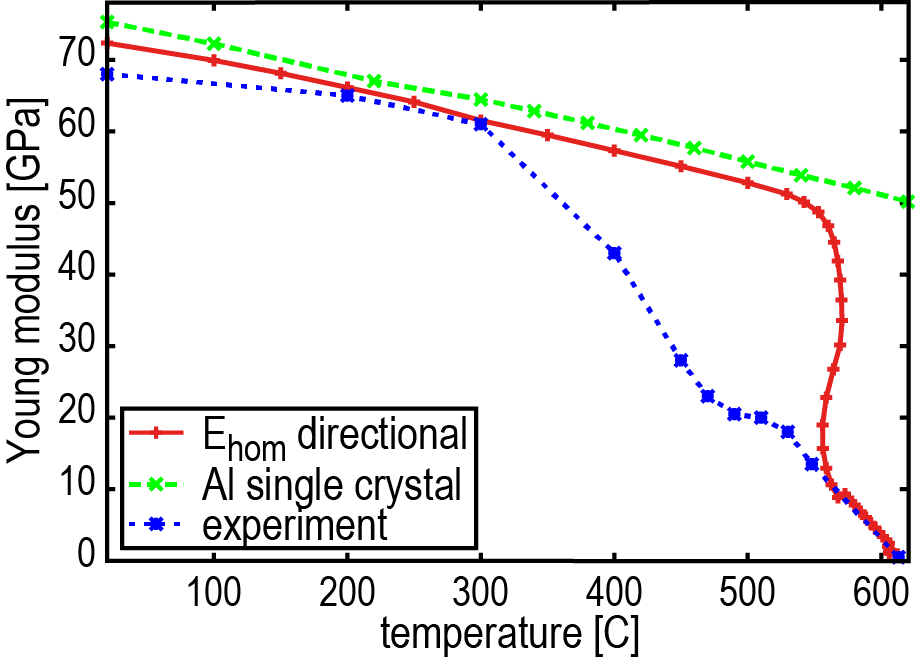
Fig.6: The temperature dependences of the mean Young modulus of the directional microstructure, the experimental one and of the Young modulus of the pure Al single crystal are plotted for the whole cooling regime
CFD simulation of melt flow through a microstructure
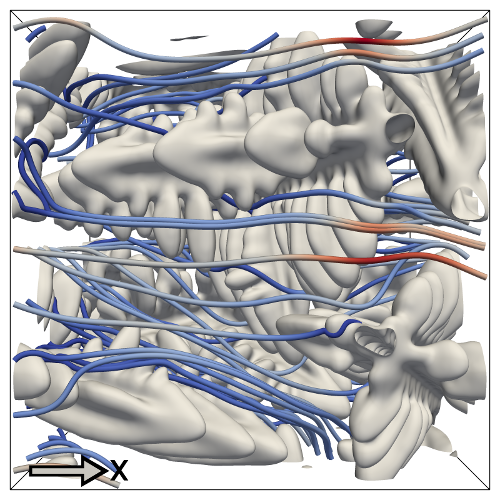
Fig.1: Streamlines of flow through AlSi7Mg0.3 microstructure along X-axis
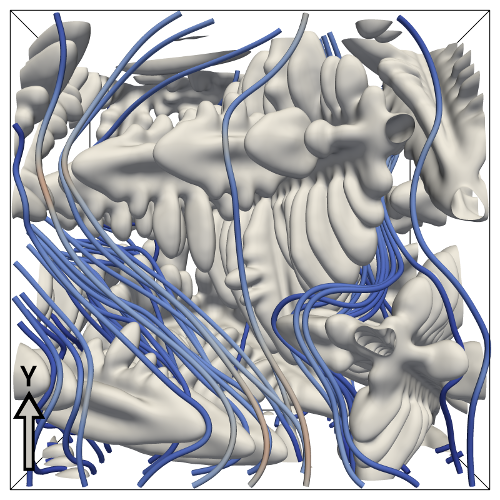
Fig.2: Streamlines of flow through AlSi7Mg0.3 microstructure along Y-axis
The microstructure of a solidifying AlSi7Mg0.3 (A356) alloy was simulated with MICRESS®. At several timesteps the permeability for melt flow through the microstructure was determined by CFD-simulations. The images of figures 1 and 2 show resulting streamlines for flow in x- and y- direction through a directionally grown structure (with temperature gradient in z-direction) from a top view.
Joint project : Wieland AG
Source: Wieland-Werke AG, Germany
Joint project: Wieland-Werke AG and Access e.V.
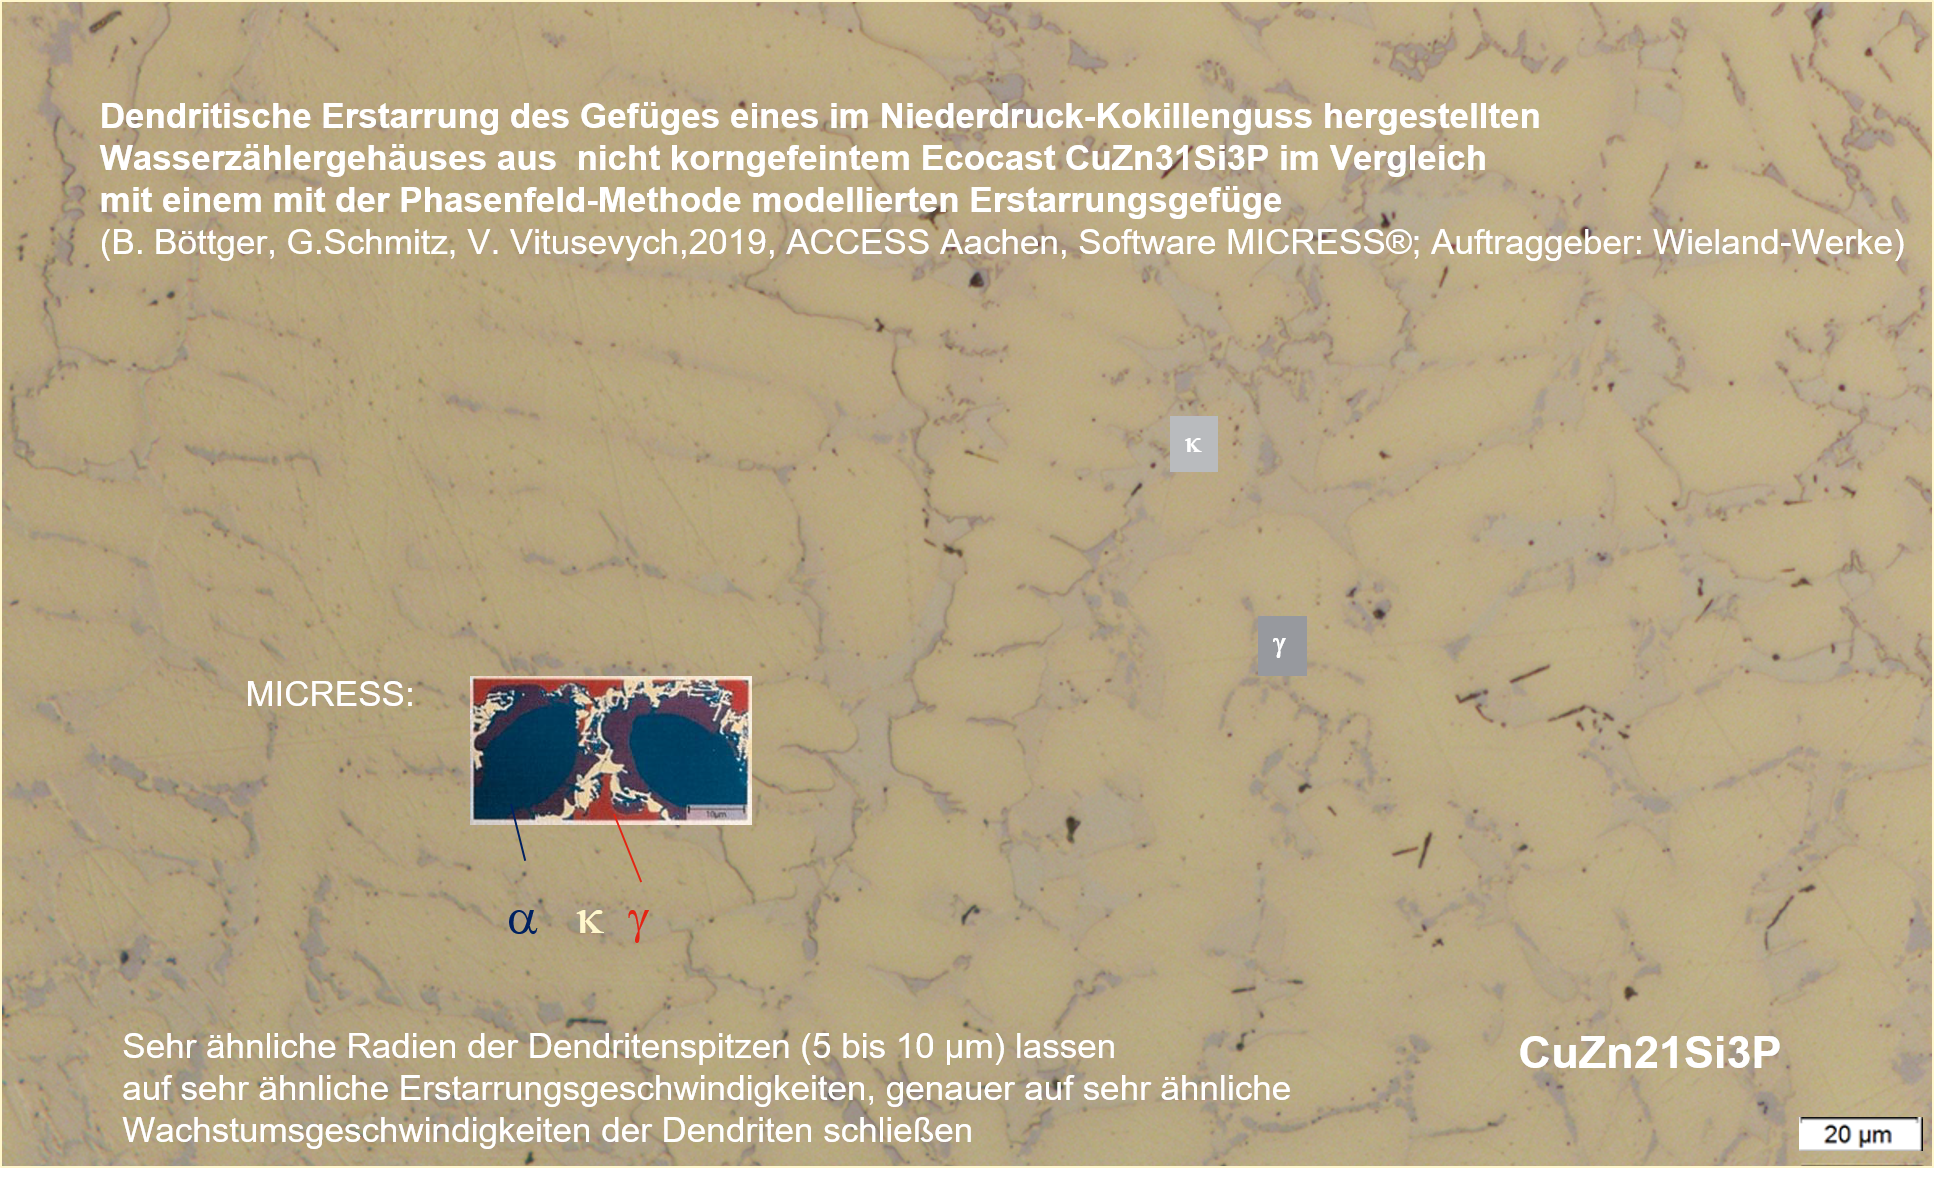
Multi-phase-field modelling of dendritic solidification and phase-formation during
low-pressure die-casting of a copper brass alloy (Ecocast, CuZn31Si3P).
Focus of the activity was on the formation sequence of the α , γ and κ phases.
(Contractual work for Wieland Werke AG)